Trace Acquisition
This section demonstrates the basic data acquisition process using the nut_stm32_f103c8 as the Nut (which comes preloaded with Golden firmware for demo/testing purposes). We'll use Jupyter as the development environment (install via pip install cracknuts[jupyter]).
If you're already familiar with Jupyter, feel free to skip the basics. To learn more, visit the Project Jupyter Documentation.
Create a Jupyter Notebook
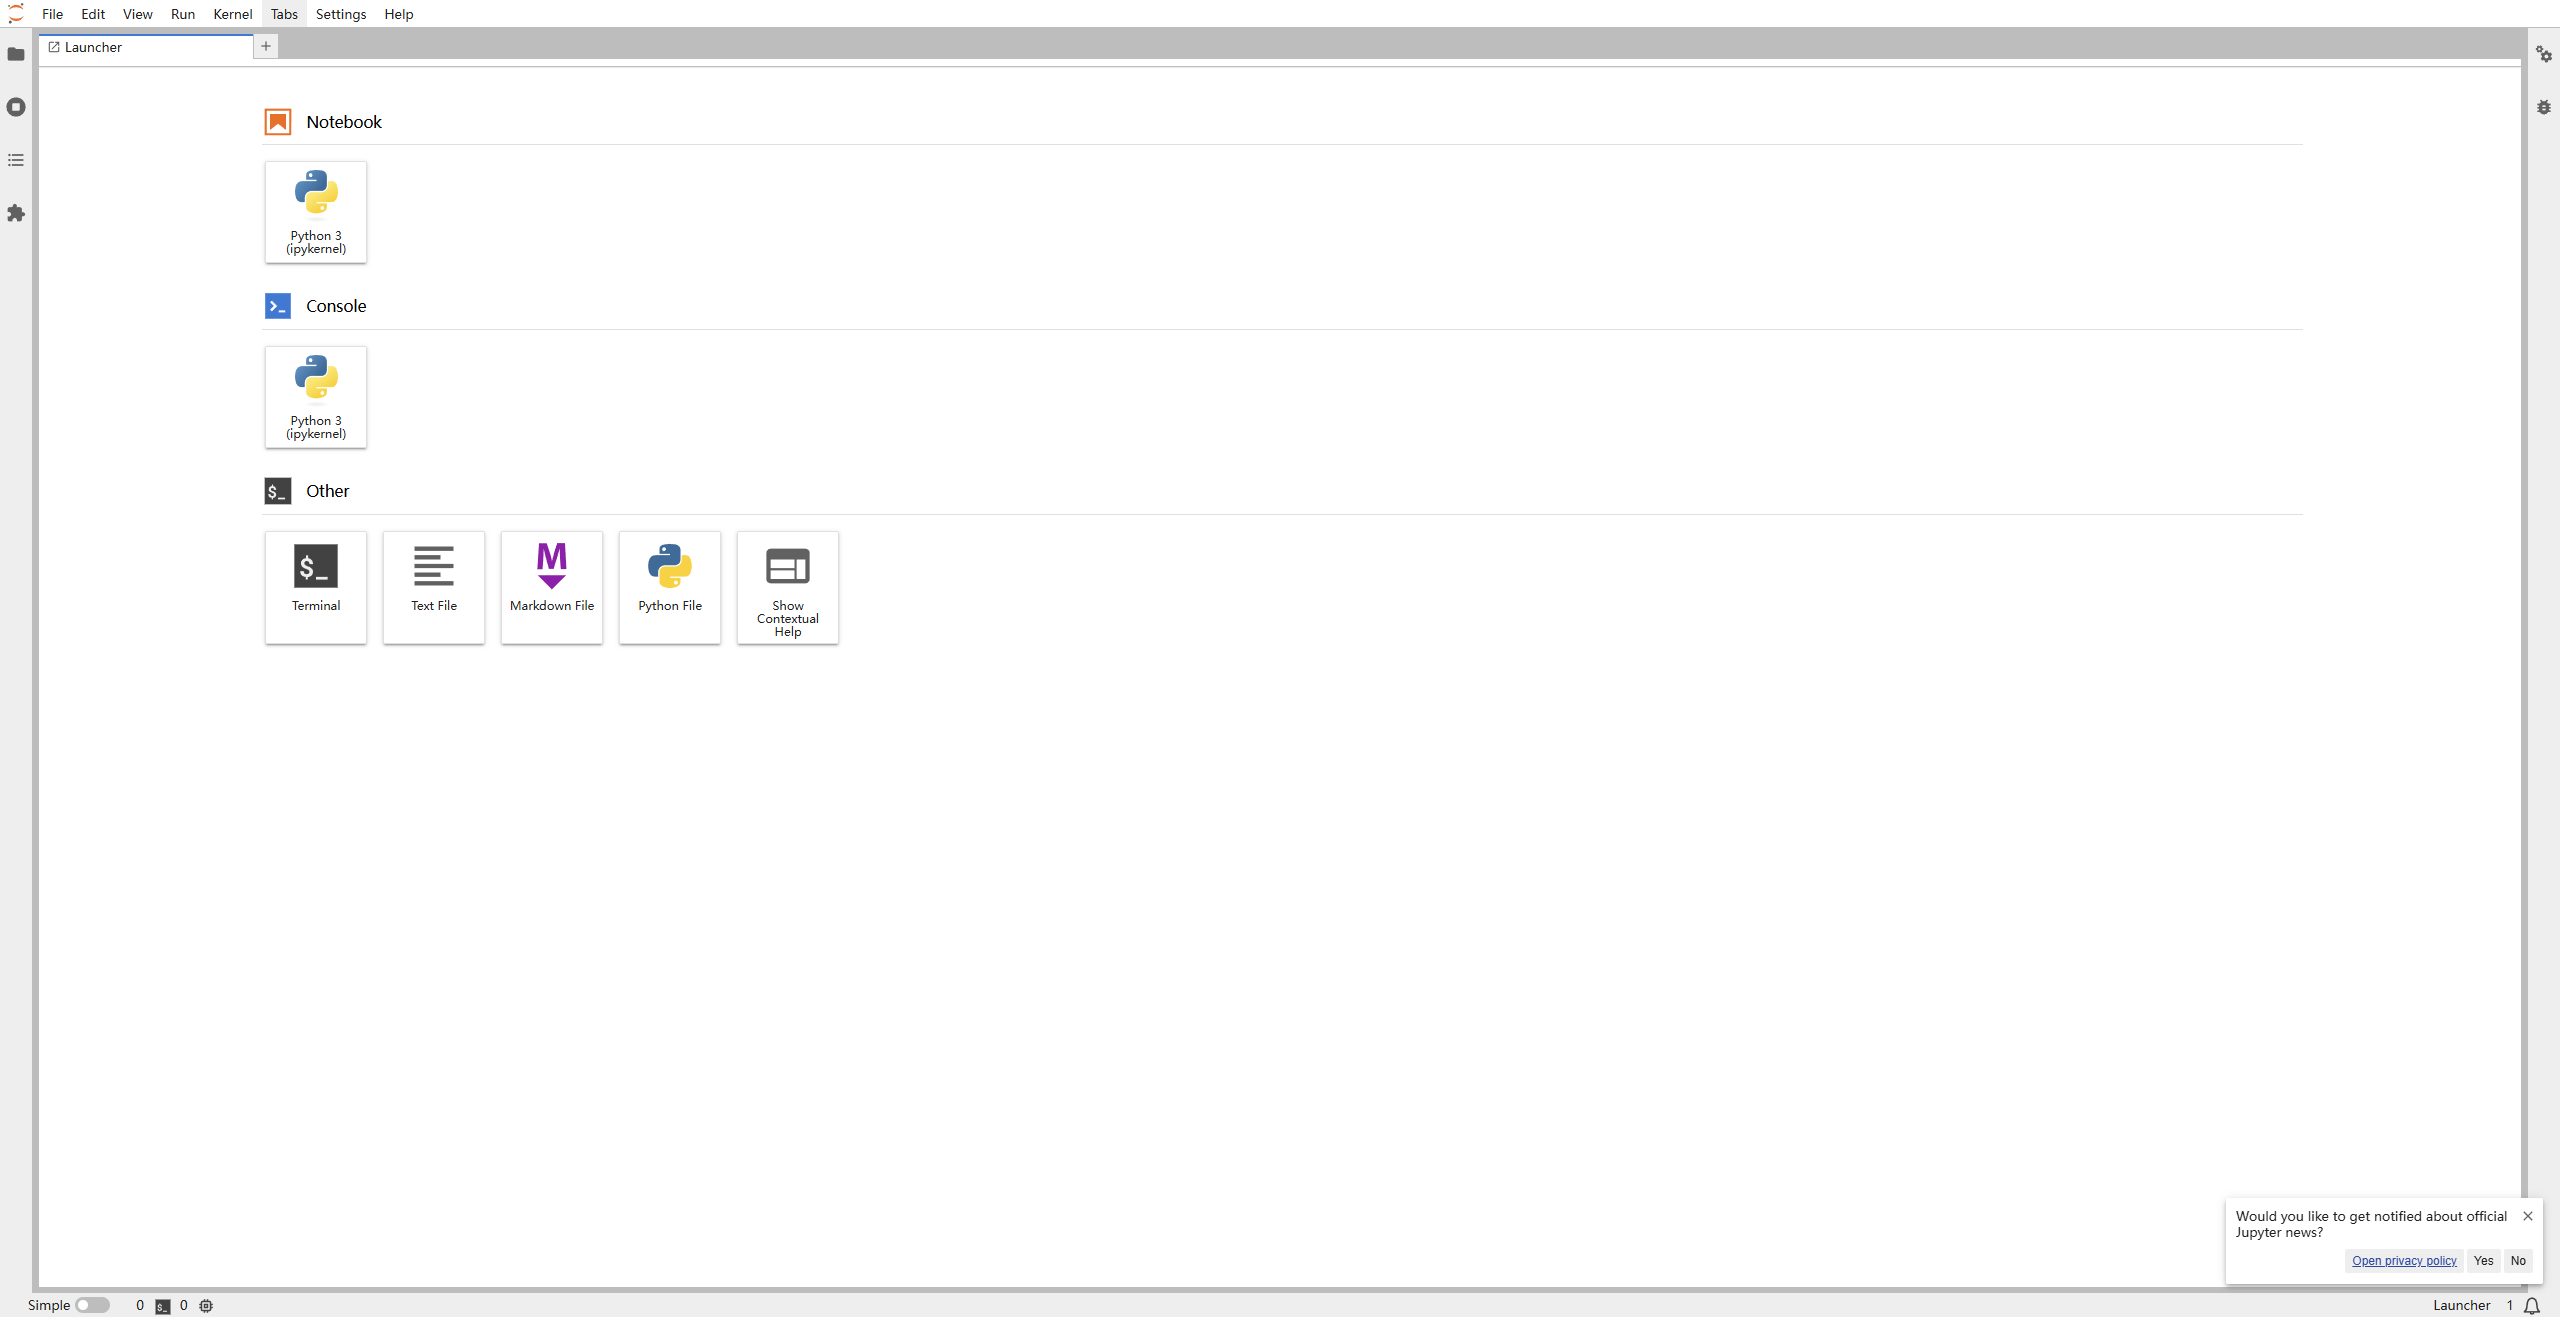
Launch Jupyter in the CrackNuts environment using either cracknuts lab or jupyter lab:
Jupyter defaults to English. If you want a Chinese interface, run pip install jupyterlab-language-pack-zh-CN and switch language in Settings -> Language.
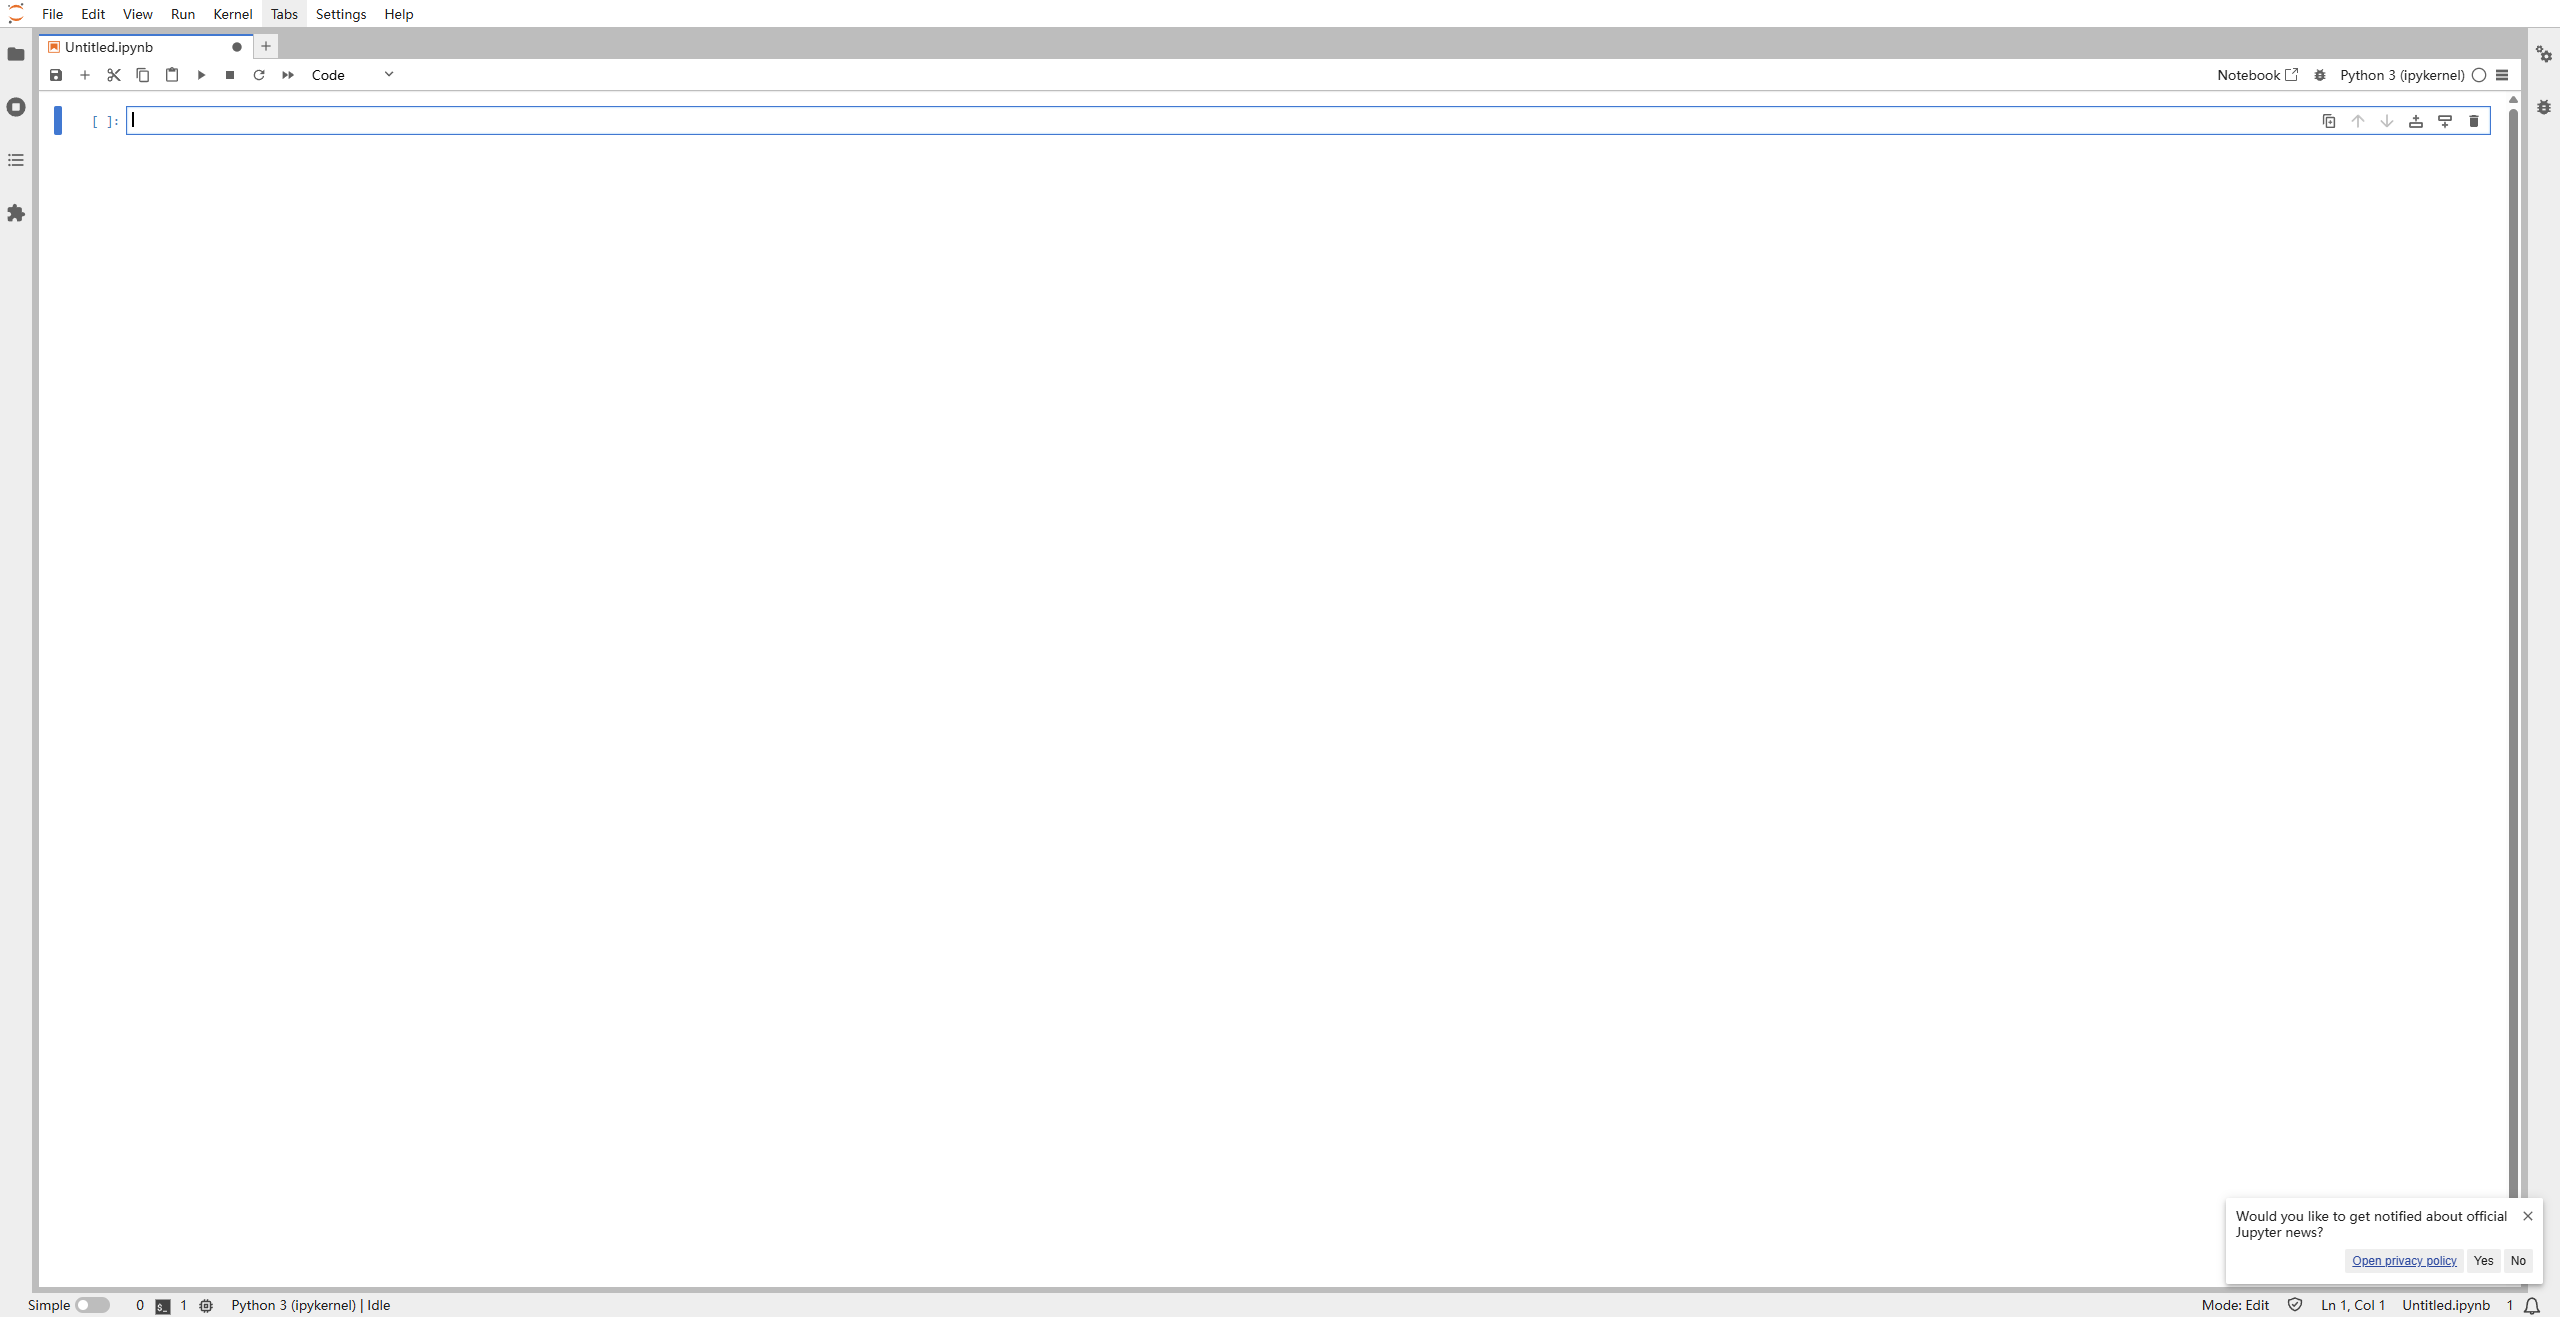
Double-click Notebook -> Python3(ipykernel) on the Jupyter start page to create a new notebook:
Connect to Device
In the new notebook, insert and run the following code to create a CrackerS1 device object and connect:
# Import dependency
import cracknuts as cn

# Create cracker
cracker = cn.new_cracker('192.168.0.10')
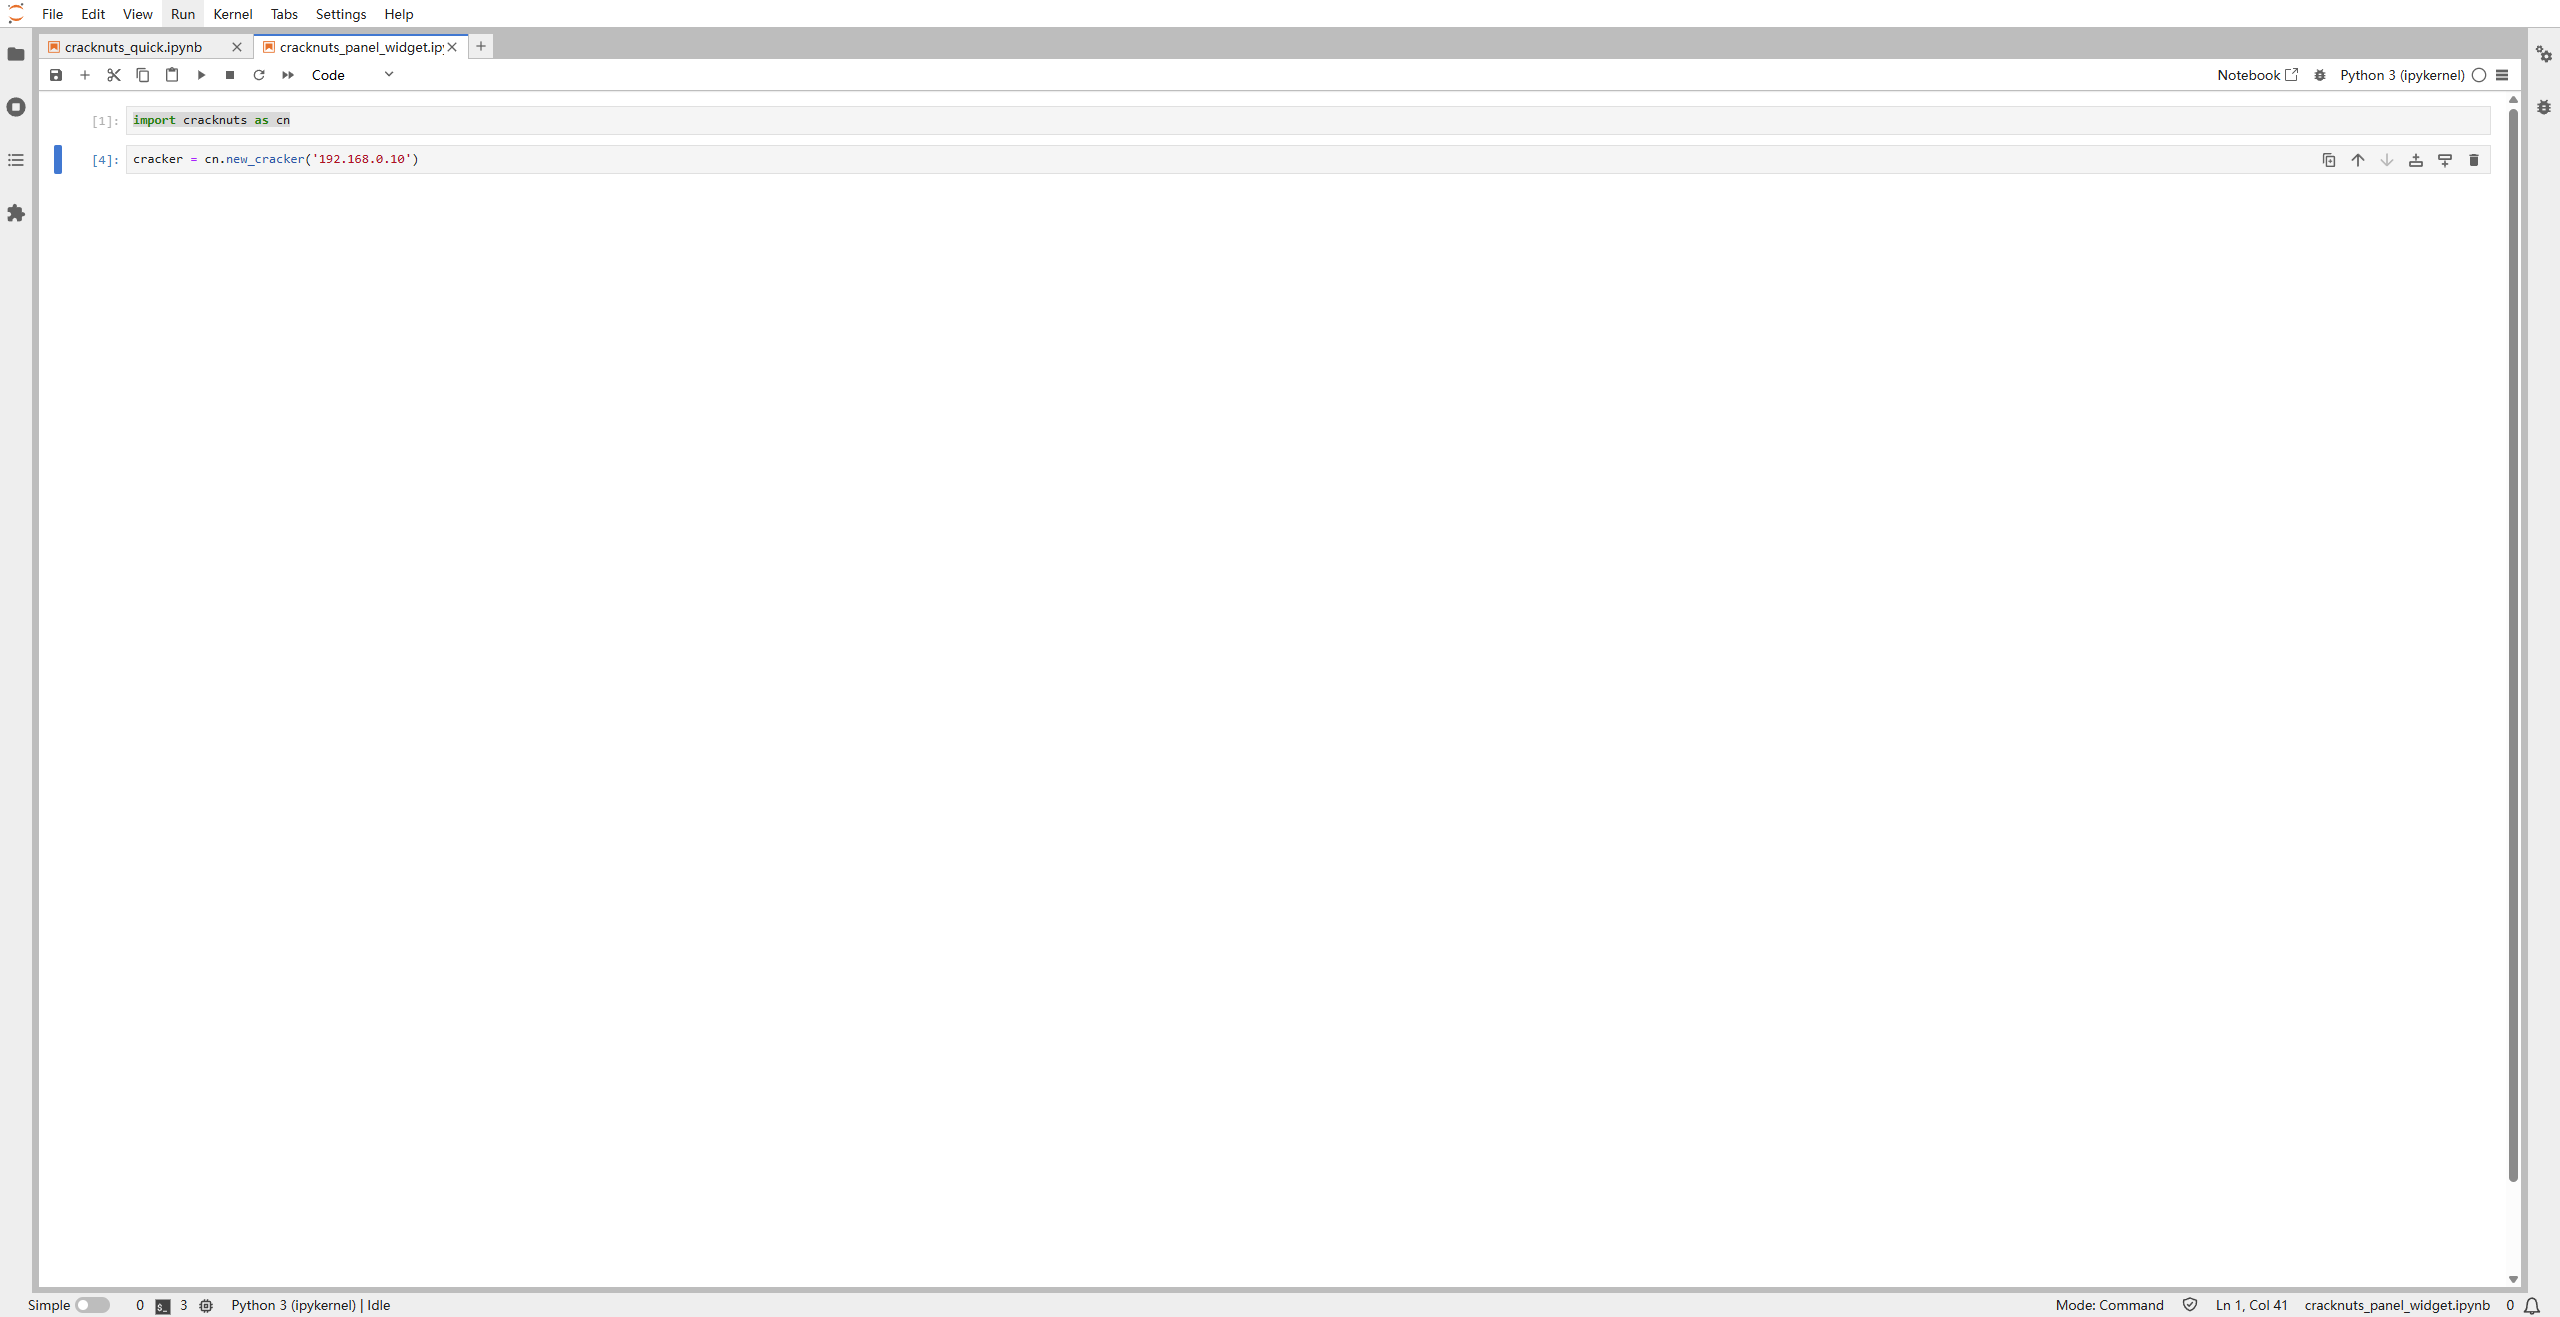
192.168.0.10 is the default IP address for CrackerS1. Adjust it to match your actual configuration.
cn.new_cracker('192.168.0.10') defaults to S1 device type. To specify another model, use:
cn.new_cracker('192.168.0.10', module = CrackerG1) or module = 'G1'.
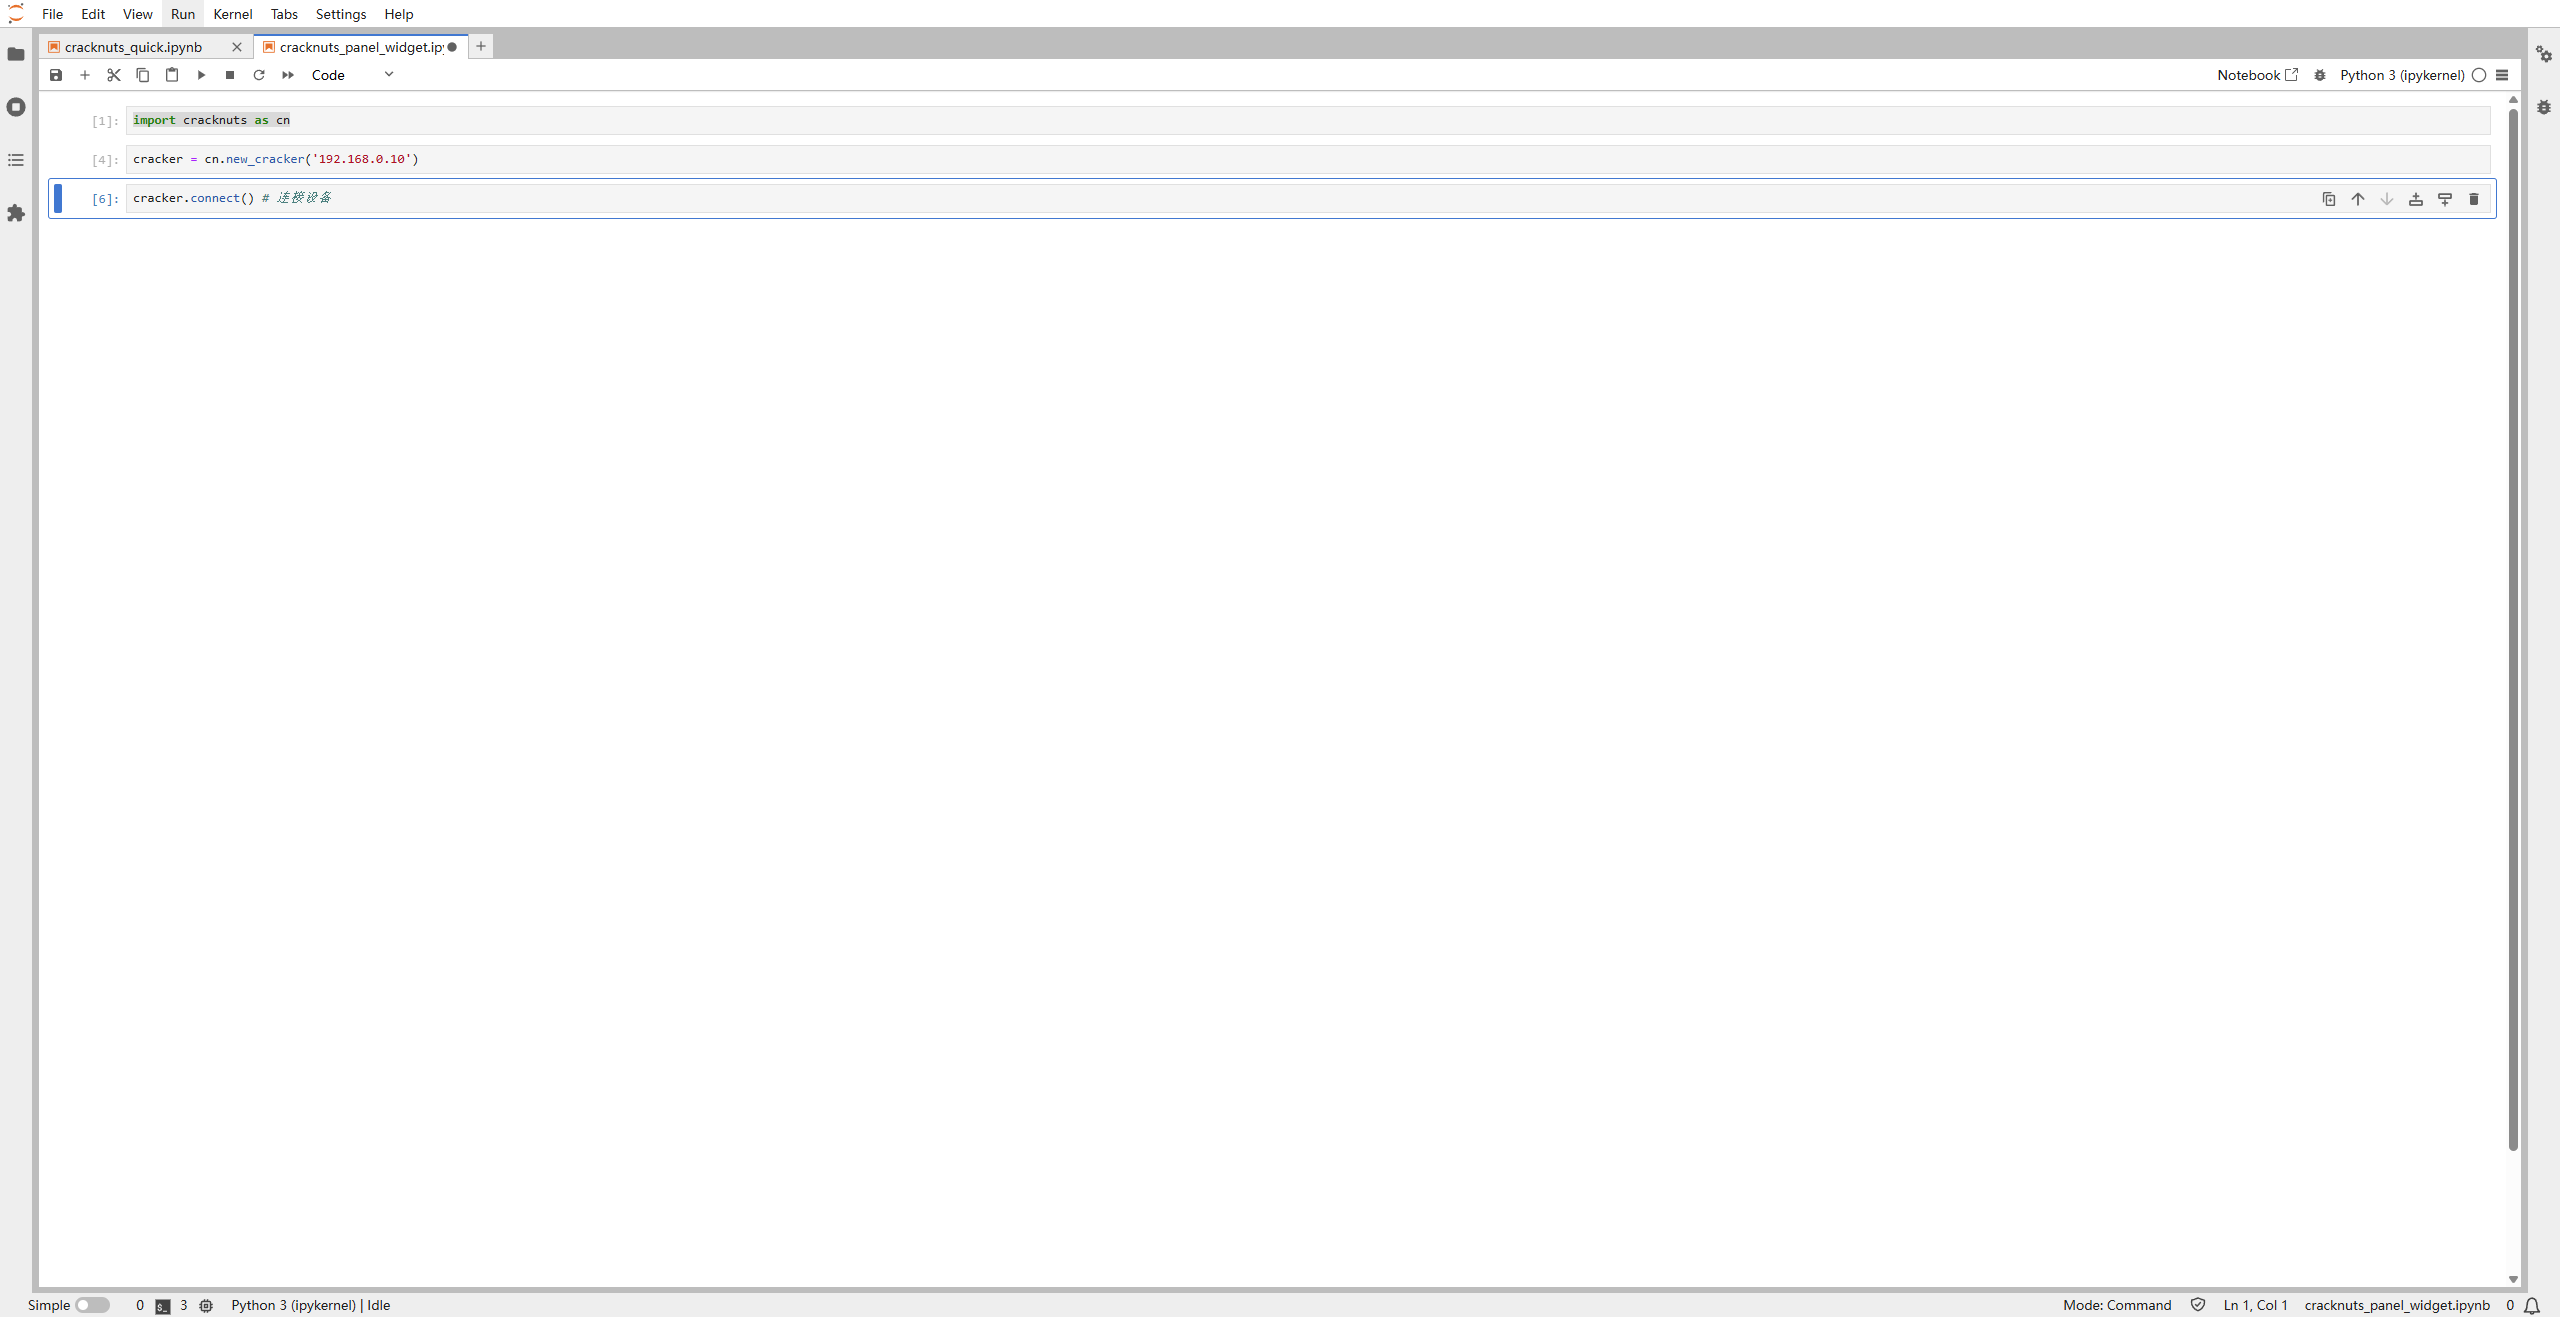
Make sure the device is network-accessible. Then connect by running:
cracker.connect()
If the connection fails, you’ll see an error like this:
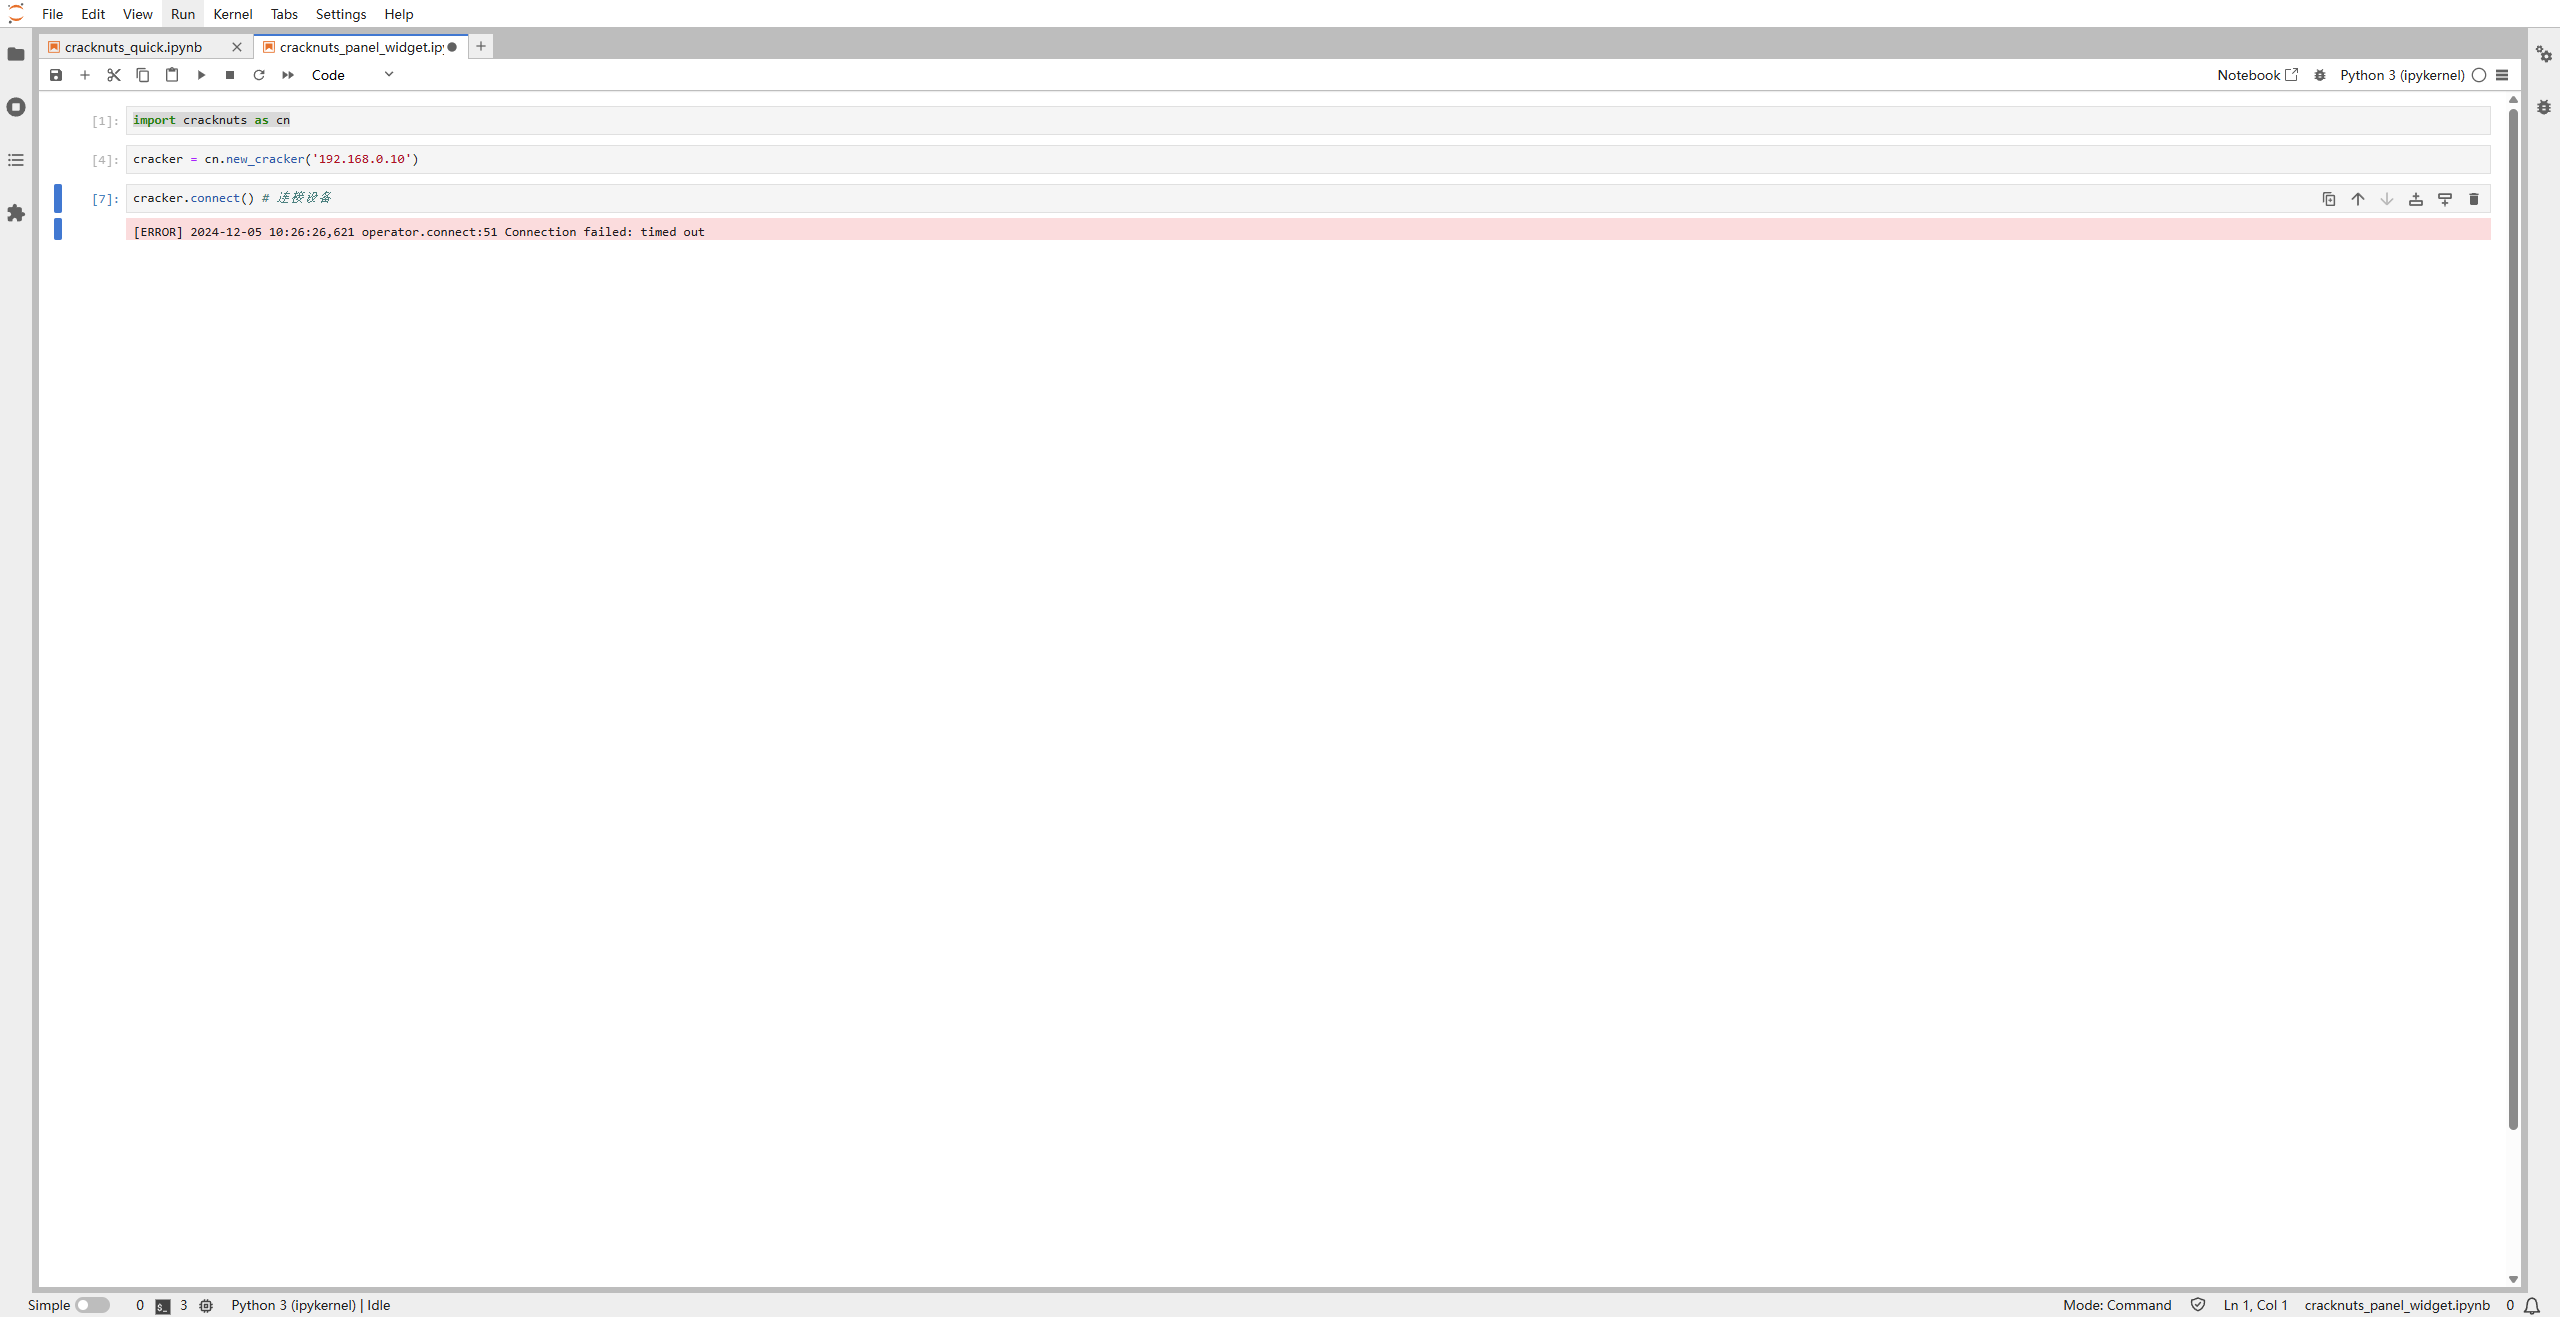
If the Cracker is connected directly via Ethernet, set your PC’s IP to 192.168.0.11/24 and use ping to verify connection.
Get Device Info
To retrieve the device ID:
cracker.get_id()

Create the Control Flow
A control flow defines a repeatable acquisition process. Acquisition is the CrackNuts class that manages this.
Below is a basic setup for acquiring AES traces from a CrackerS1 with STM32:
import random
import time
from cracknuts.cracker import serial

cmd_set_aes_enc_key = "01 00 00 00 00 00 00 10"
cmd_aes_enc = "01 02 00 00 00 00 00 10"

aes_key = "11 22 33 44 55 66 77 88 99 00 aa bb cc dd ee ff"
aes_data_len = 16
sample_length = 1024 * 20

def init(c):
    cracker.nut_voltage_enable()
    cracker.nut_voltage(3.4)
    cracker.nut_clock_enable()
    cracker.nut_clock_freq('8M')
    cracker.uart_enable()
    cracker.osc_sample_clock('48m')
    cracker.osc_sample_length(sample_length)
    cracker.osc_trigger_source('N')
    cracker.osc_analog_gain('B', 10)
    cracker.osc_trigger_level(0)
    cracker.osc_trigger_mode('E')
    cracker.osc_trigger_edge('U')
    cracker.uart_config(
        baudrate=serial.Baudrate.BAUDRATE_115200,
        bytesize=serial.Bytesize.EIGHTBITS,
        parity=serial.Parity.PARITY_NONE,
        stopbits=serial.Stopbits.STOPBITS_ONE
    )

    time.sleep(2)
    cmd = cmd_set_aes_enc_key + aes_key
    status, ret = cracker.uart_transmit_receive(cmd, timeout=1000, rx_count=6)

def do(c):
    plaintext_data = random.randbytes(aes_data_len)
    tx_data = bytes.fromhex(cmd_aes_enc.replace(' ', '')) + plaintext_data
    status, ret = cracker.uart_transmit_receive(tx_data, rx_count=6 + aes_data_len, is_trigger=True)

    return {
        "plaintext": plaintext_data,
        "ciphertext": ret[-aes_data_len:],
        "key": bytes.fromhex(aes_key)
    }

acq = cn.new_acquisition(cracker, do=do, init=init)
This defines init (setup) and do (acquire) methods that operate with the cracker object.
Cracker Acquisition Control Panel
Display the Cracker acquisition control panel by running:
cn.panel(acq)
Result:
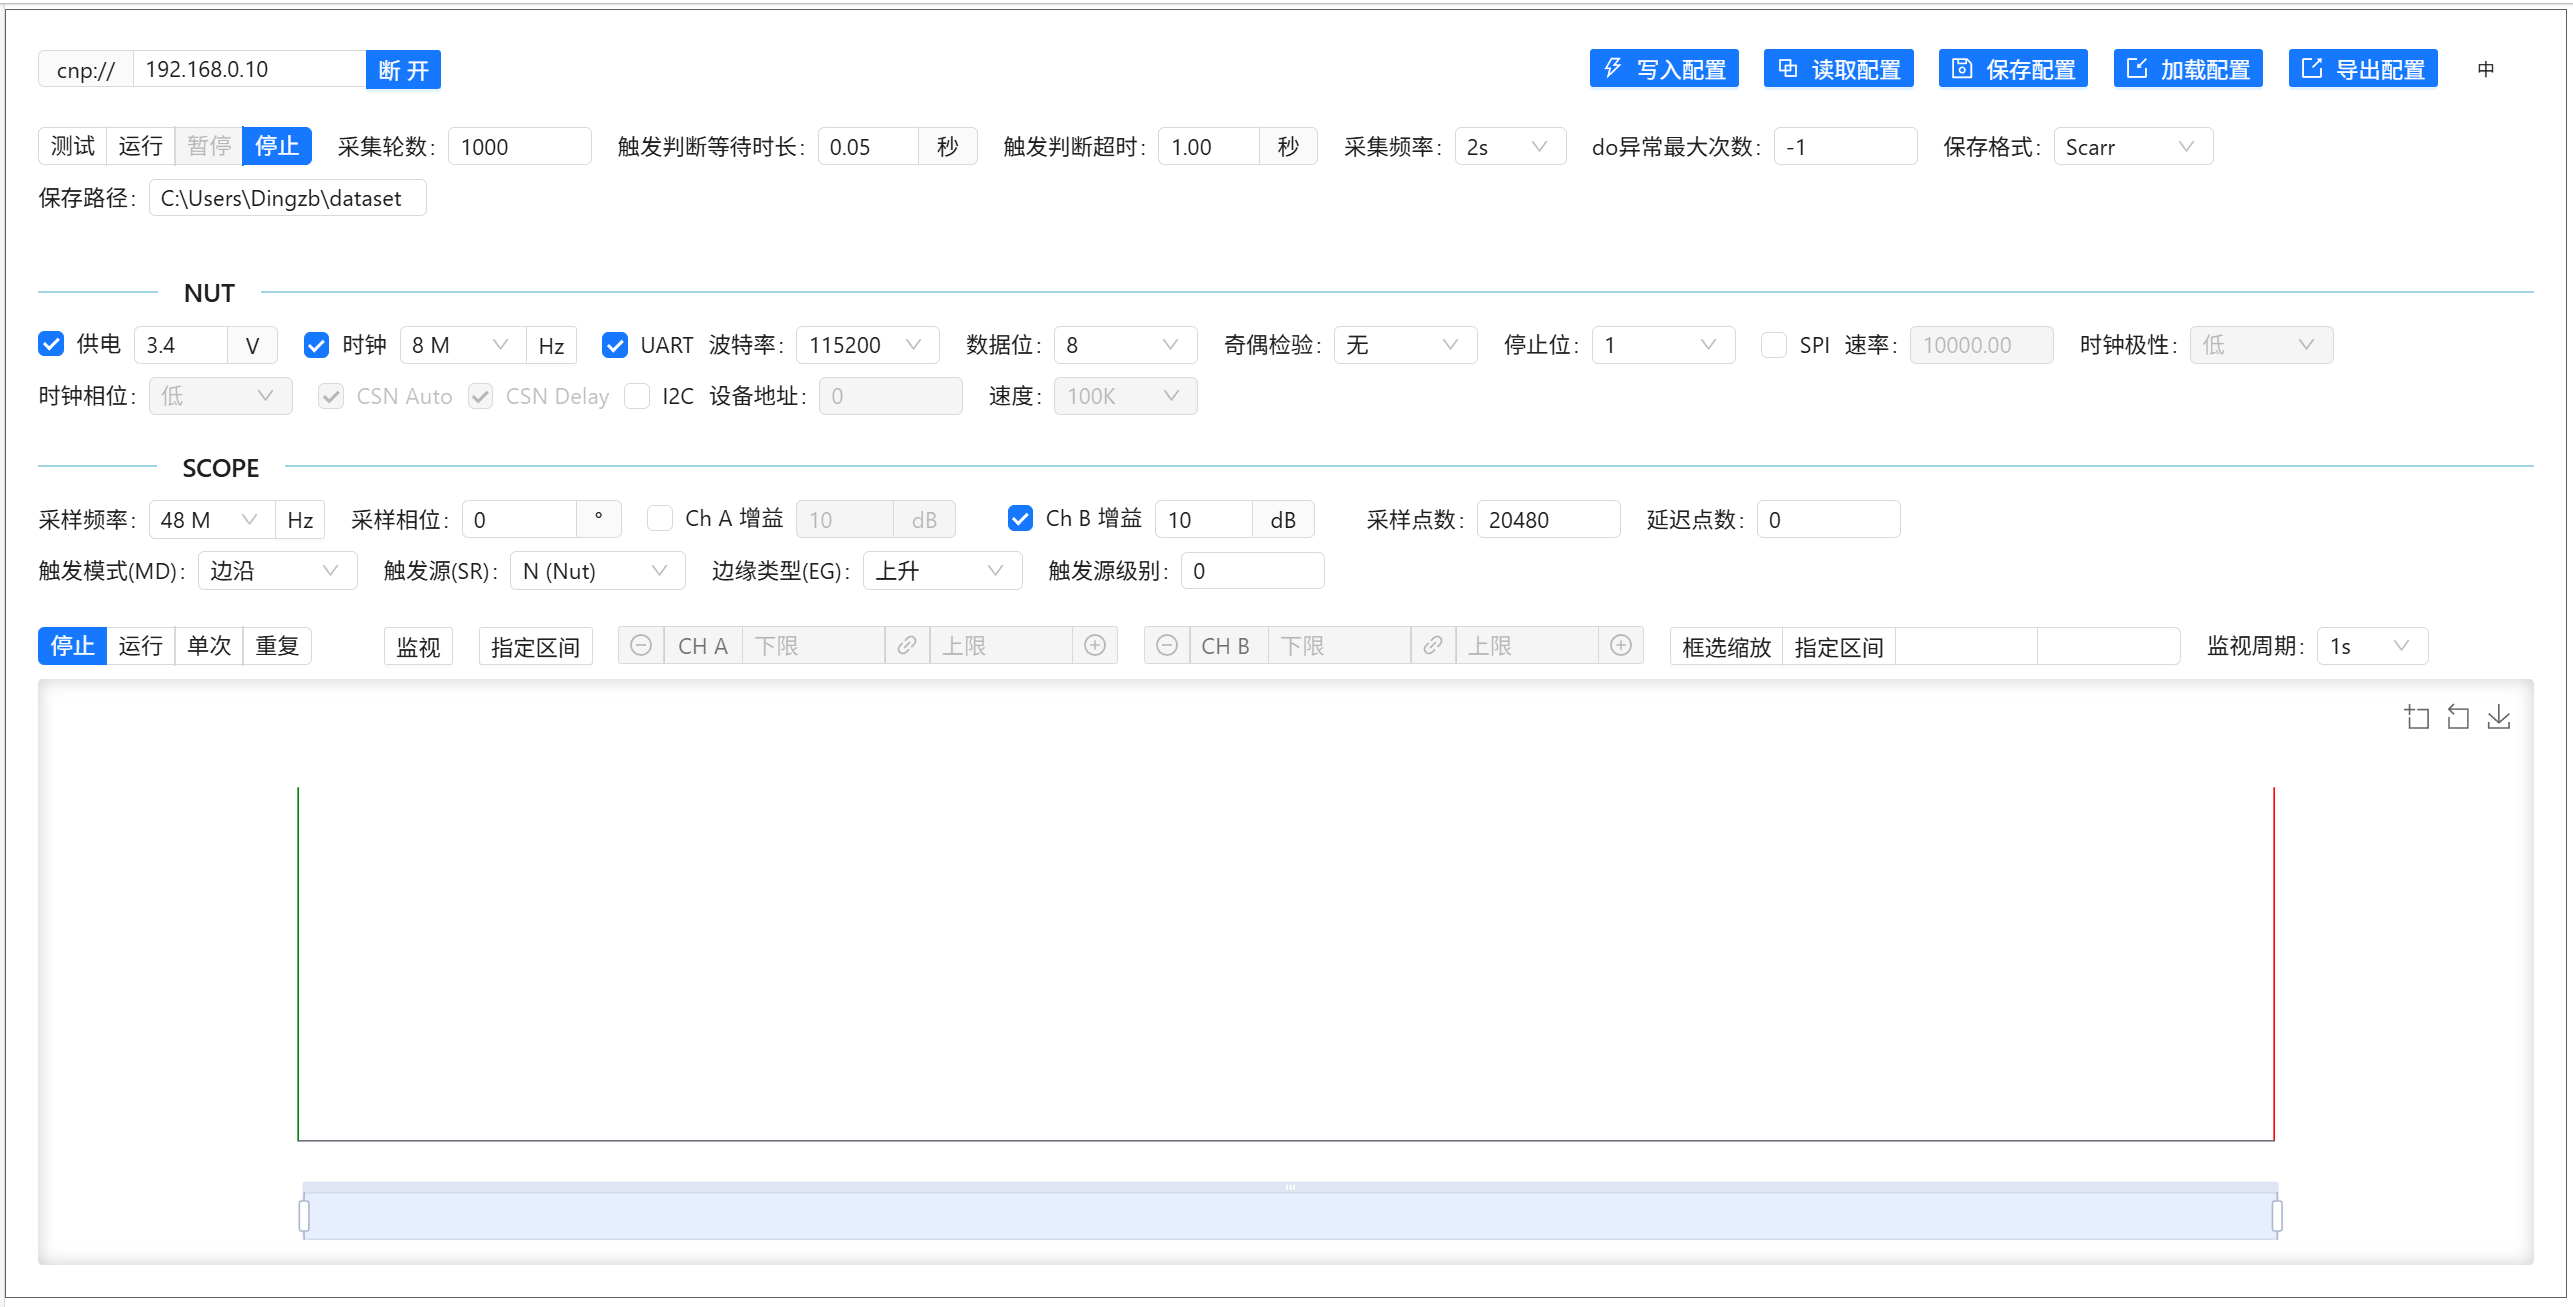
Capture Traces
In the panel, after connecting, device info will be displayed. Use the "Test" button to preview waveform acquisition (ensure monitoring is enabled):
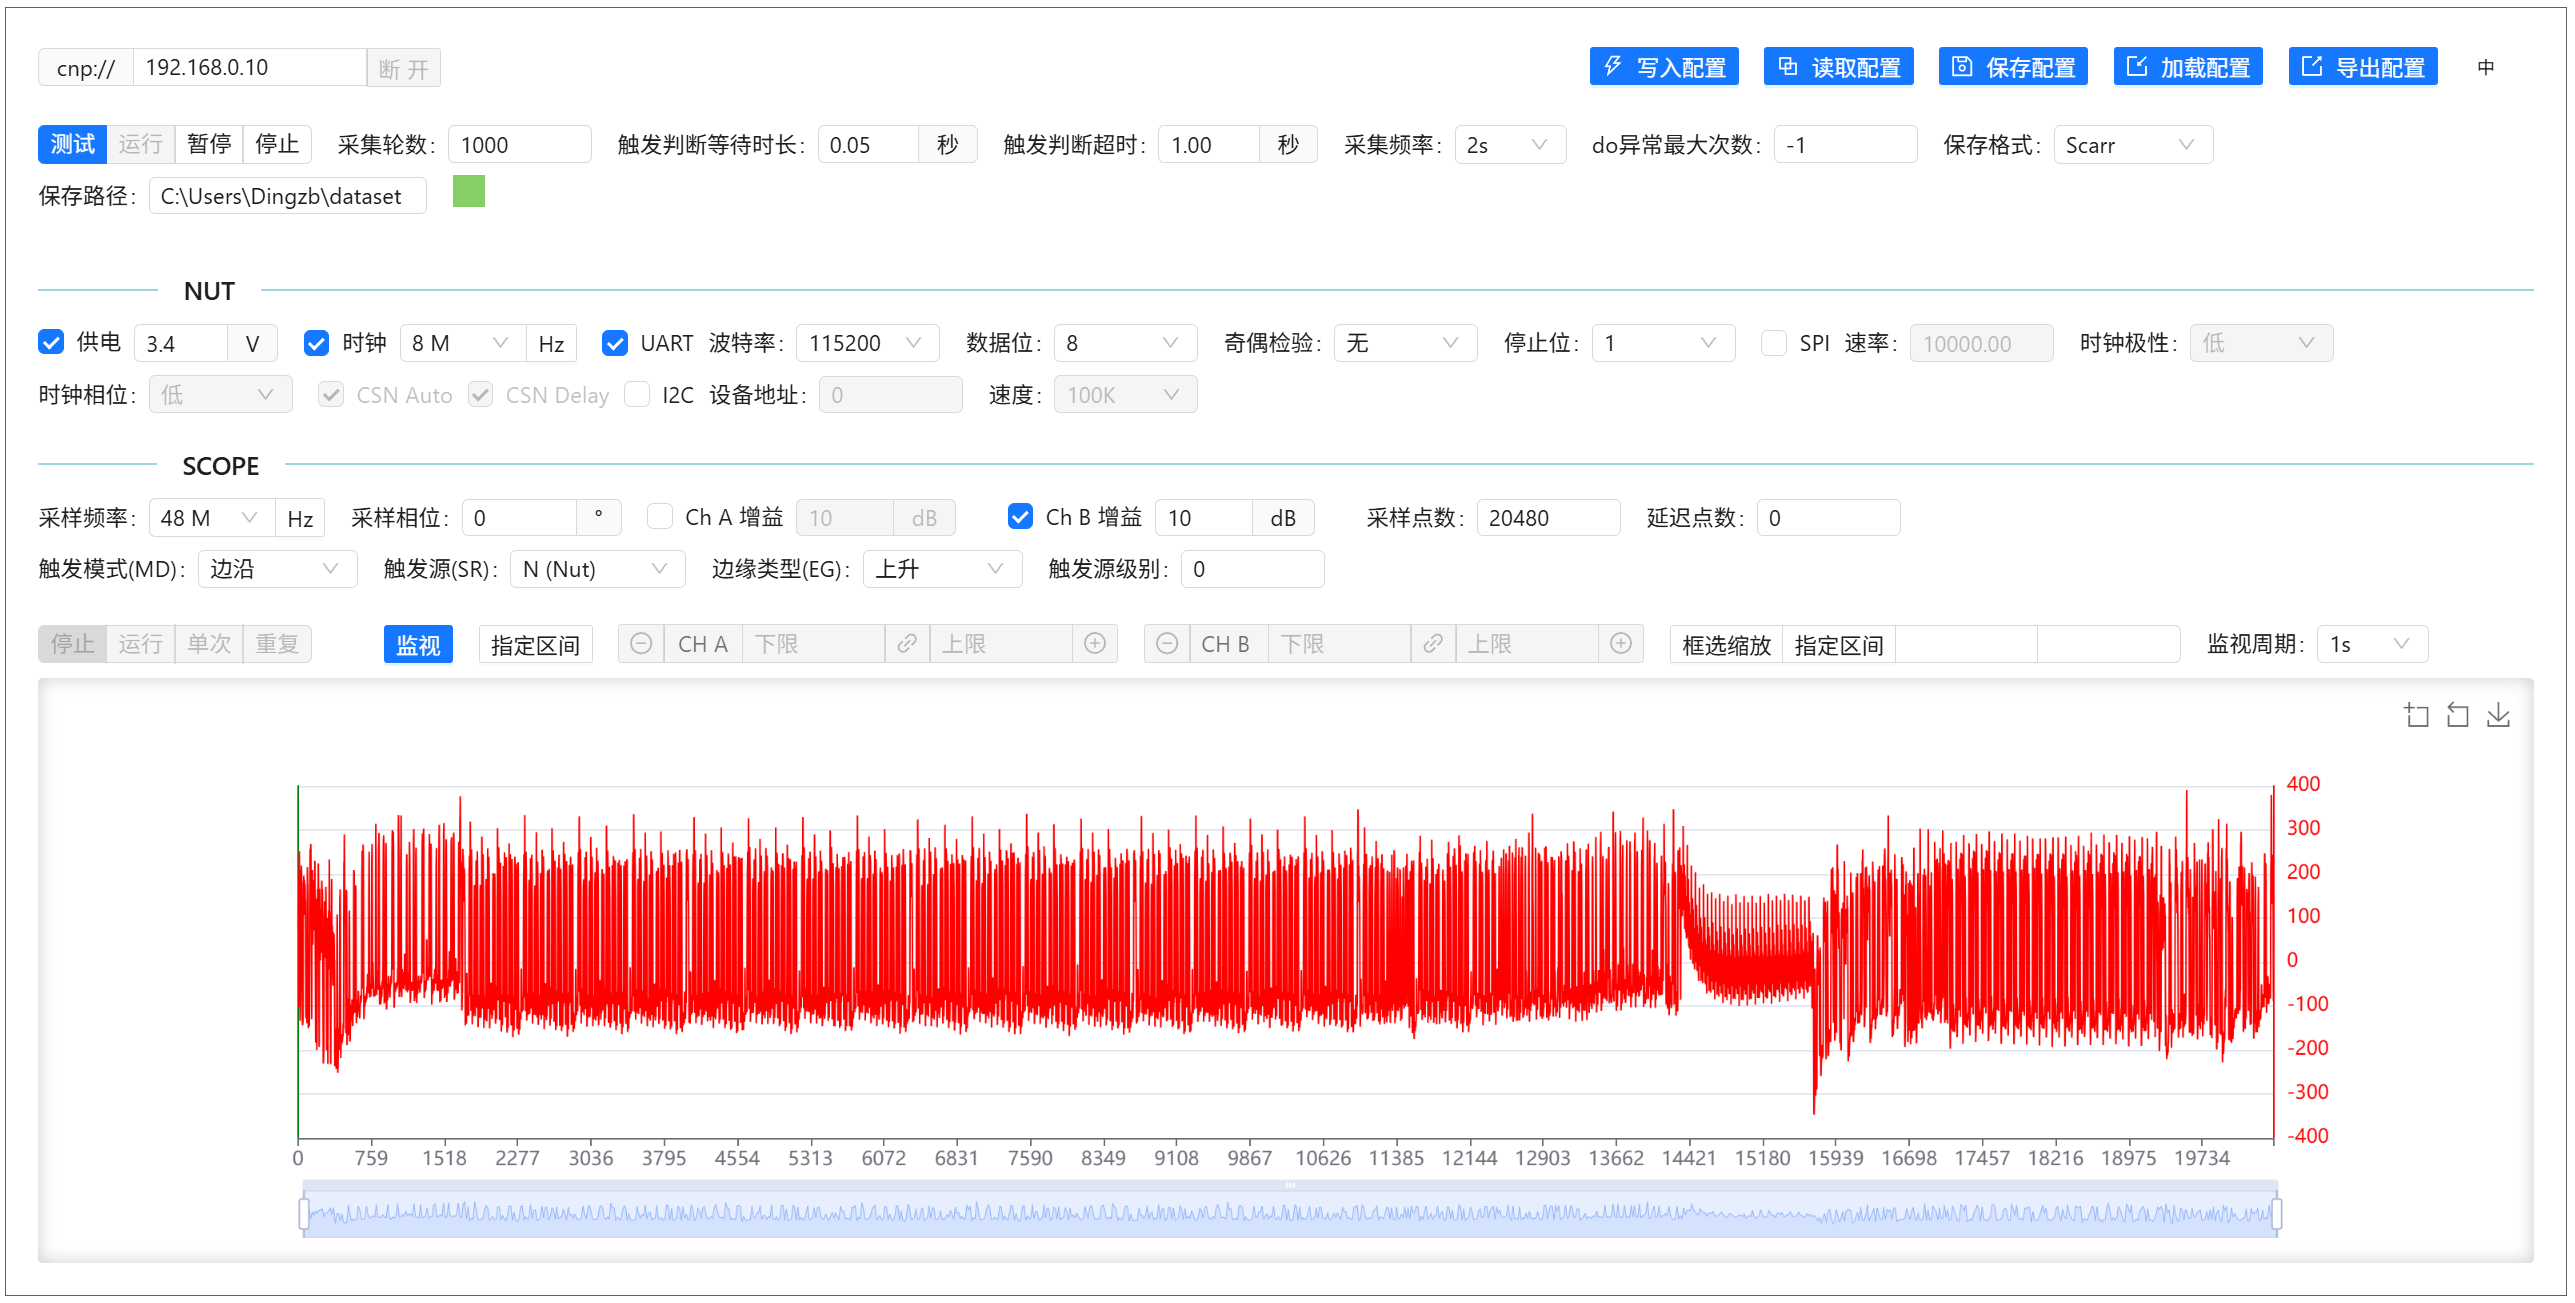
Once parameters are set (Golden firmware defaults should work), stop the test and click “Run” to start acquisition and save the trace data:
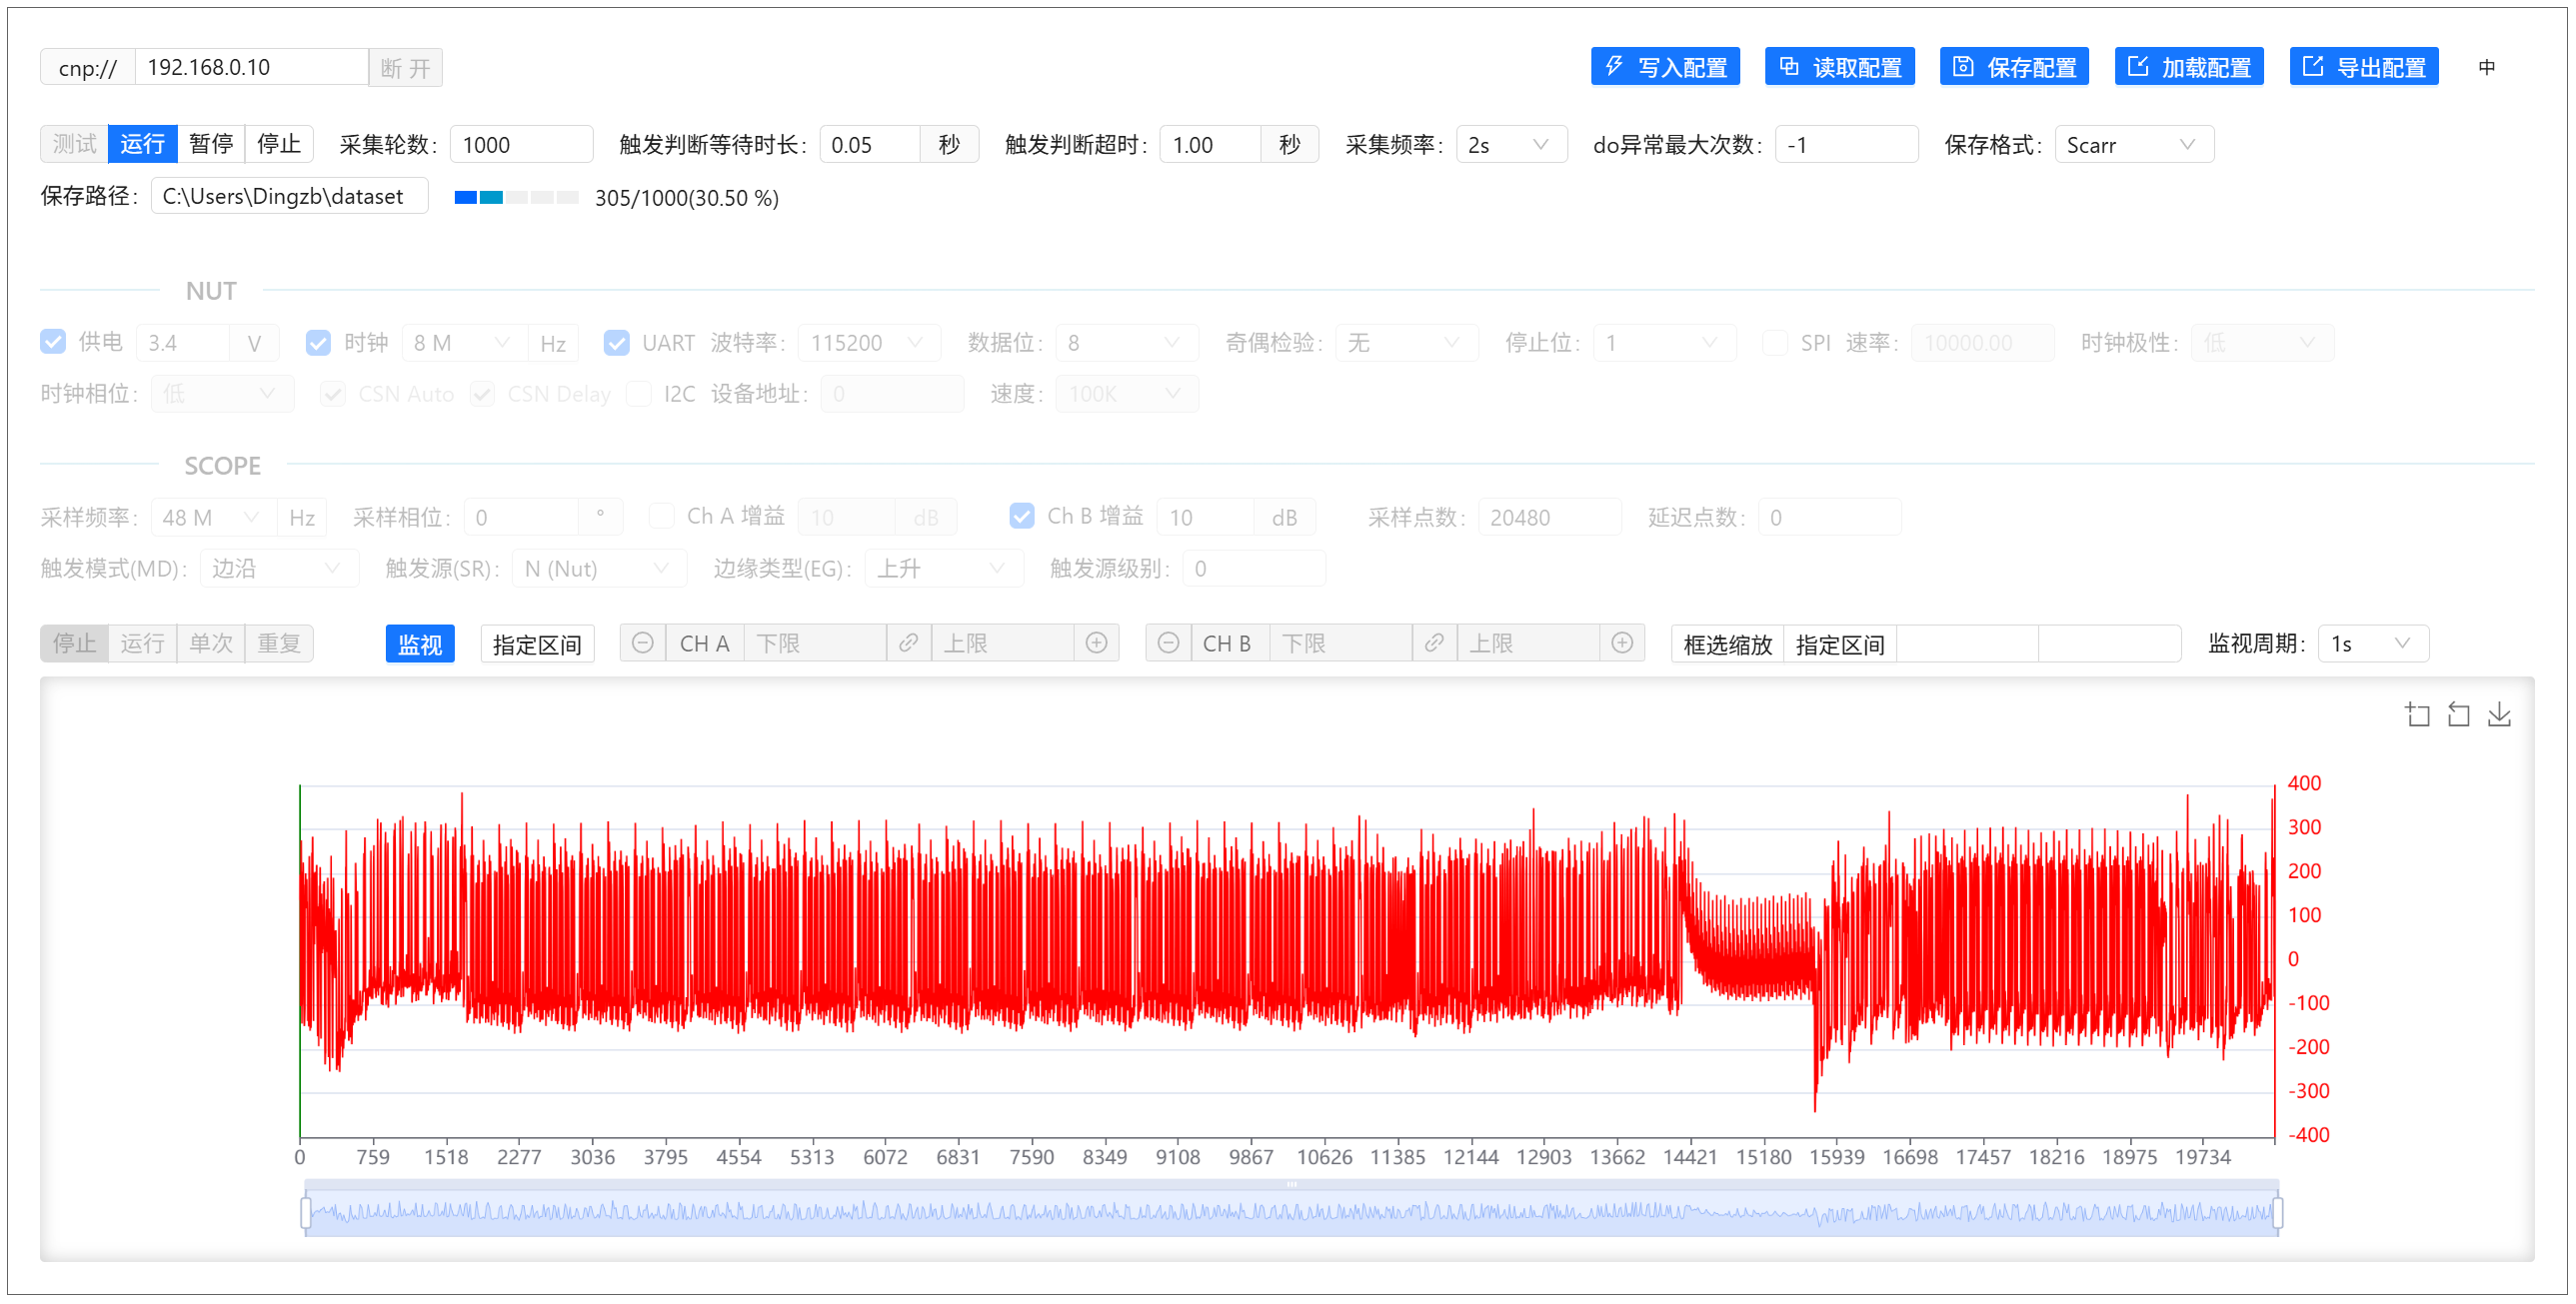
Congratulations! You’ve successfully captured AES power traces using CrackNuts.
The default Nut (stm32_f103c8) includes pre-flashed HSI.elf. Additional firmwares can be downloaded from:
https://pan.baidu.com/s/1PXyKqeTfemepZ-wD9gDwYQ?pwd=2cda (See NutGolden folder).
Using the Trace Data
Captured traces are stored using the scarr format, based on zarr with CrackNuts metadata.
Format structure:
- traces:
directory.zarr/X/Y/traces
- metadata:
directory.zarr/X/Y/ciphertextdirectory.zarr/X/Y/plaintext- (optional)
directory.zarr/X/Y/key - (optional)
directory.zarr/X/Y/extended
Saved trace files are timestamped and located under a dataset folder in the notebook's root. Load them using:
Option 1: CrackNuts Interface
from cracknuts.trace import ScarrTraceDataset
ds = ScarrTraceDataset.load(r'dataset\20250512163354.zarr')
Visualize using:
import cracknuts as cn
pt = cn.panel_trace()
pt.set_trace_dataset(ds)
pt
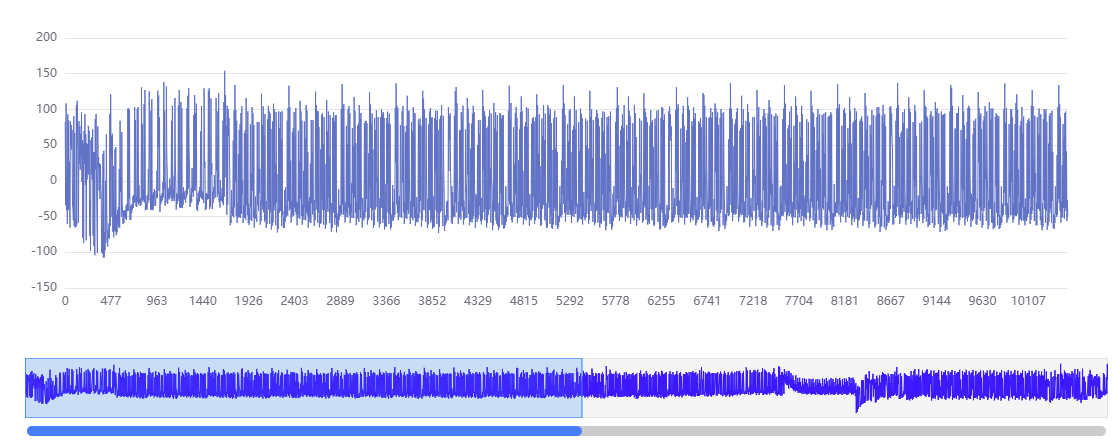
Control displayed index and range:
pt.show_trace[0, 10:20]  # Channel 0, trace 10–19
pt.change_range(400, 1000)  # Samples 400–999
Option 2: Directly with zarr
import zarr

zd = zarr.open(r'D:\project\cracknuts\demo\jupyter\dataset\20250515165503.zarr')

zd.tree()
This reveals the data structure:
